These Are Georgia's Worst Cities For Daily Commutes & It Will Make You Value Remote Working
Pre-pandemic, average daily commute times were almost an hour per day!
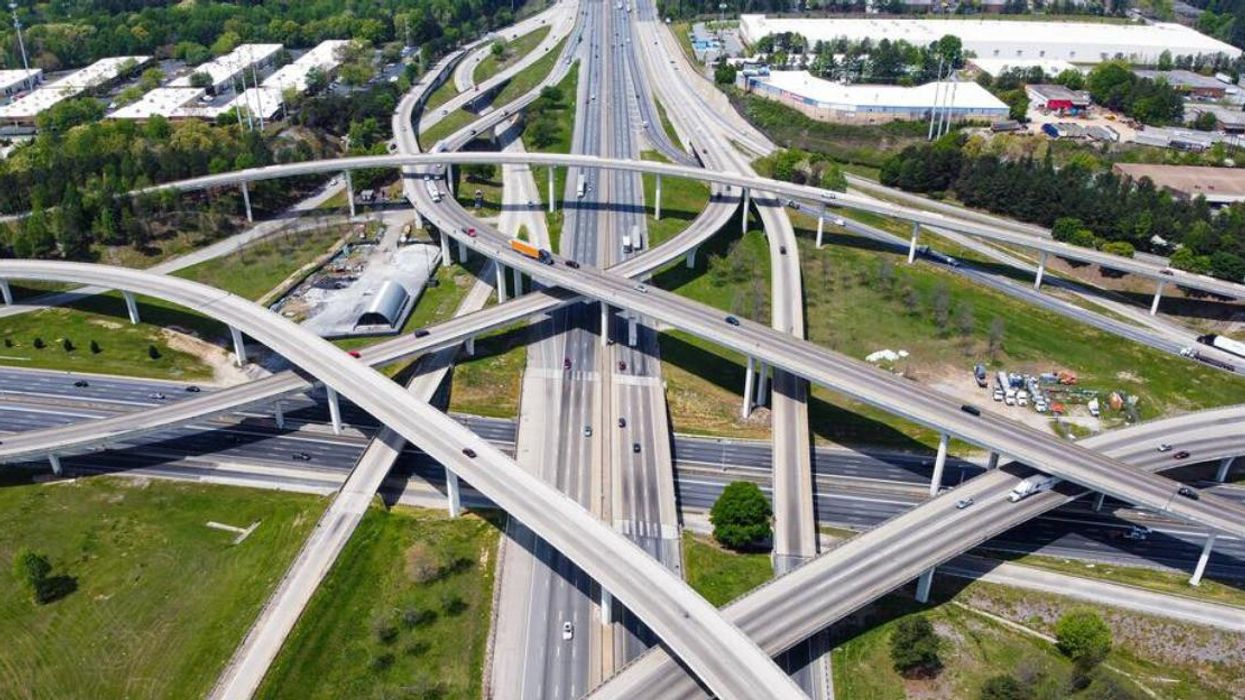
Sphaghetti Junction at the Tom Moreland Interchange, in Georgia.
When the COVID-19 pandemic forced millions of Americans to start working remotely, it also abruptly ended the commutes that bookend the workday. As some of those workers return to the office in 2022, conversations around the drawbacks of commutes have resumed.
For a while, remote workers enjoyed more time in the morning and evening that wasn’t spent simply traveling to and from work—an unpaid portion of the day that nevertheless eats up time and energy. And it’s not a small amount of time, either: Pre-pandemic, the average commute in the U.S. was a hair over 27 minutes one way, according to U.S. Census Bureau data. Cumulatively, that translates to 54 minutes a day, or four-and-a-half hours per week and 216 hours a year.
Of course, not all commutes are as bad as others, and some cities have better public transit and traffic flow. Stacker compiled a list of the cities with the worst commutes in Georgia using data from the U.S. Census Bureau. Cities with at least 5,000 working adults are ranked by the longest average commute time as of the 2019 five-year estimate.
#20. Sugar Hill
- Average time spent commuting to work (minutes): 33.4
--- Percent of workers spending less than 30 minutes commuting: 46.7%
--- Percent of workers spending more than an hour commuting: 15.1%
#19. Johns Creek
- Average time spent commuting to work (minutes): 33.5
--- Percent of workers spending less than 30 minutes commuting: 46.2%
--- Percent of workers spending more than an hour commuting: 15.7%
#18. Mableton
- Average time spent commuting to work (minutes): 33.7
--- Percent of workers spending less than 30 minutes commuting: 40.5%
--- Percent of workers spending more than an hour commuting: 13.3%
#17. Suwanee
- Average time spent commuting to work (minutes): 34
--- Percent of workers spending less than 30 minutes commuting: 50.7%
--- Percent of workers spending more than an hour commuting: 16.4%
#16. Kennesaw
- Average time spent commuting to work (minutes): 34.2
--- Percent of workers spending less than 30 minutes commuting: 42.5%
--- Percent of workers spending more than an hour commuting: 20.4%
#15. South Fulton
- Average time spent commuting to work (minutes): 34.3
--- Percent of workers spending less than 30 minutes commuting: 42.5%
--- Percent of workers spending more than an hour commuting: 15.4%
#14. Canton
- Average time spent commuting to work (minutes): 34.4
--- Percent of workers spending less than 30 minutes commuting: 47.4%
--- Percent of workers spending more than an hour commuting: 20.6%
#13. Fayetteville
- Average time spent commuting to work (minutes): 34.5
--- Percent of workers spending less than 30 minutes commuting: 46.9%
--- Percent of workers spending more than an hour commuting: 17.5%
#12. Lawrenceville
- Average time spent commuting to work (minutes): 34.7
--- Percent of workers spending less than 30 minutes commuting: 43%
--- Percent of workers spending more than an hour commuting: 18.3%
#11. Braselton
- Average time spent commuting to work (minutes): 35.1
--- Percent of workers spending less than 30 minutes commuting: 43.7%
--- Percent of workers spending more than an hour commuting: 16.9%
#10. Belvedere Park
- Average time spent commuting to work (minutes): 35.4
--- Percent of workers spending less than 30 minutes commuting: 45.9%
--- Percent of workers spending more than an hour commuting: 14.9%
#9. Clarkston
- Average time spent commuting to work (minutes): 35.6
--- Percent of workers spending less than 30 minutes commuting: 43.7%
--- Percent of workers spending more than an hour commuting: 21.3%
#8. Woodstock
- Average time spent commuting to work (minutes): 35.9
--- Percent of workers spending less than 30 minutes commuting: 43%
--- Percent of workers spending more than an hour commuting: 20.3%
#7. Candler-McAfee
- Average time spent commuting to work (minutes): 36.3
--- Percent of workers spending less than 30 minutes commuting: 43.7%
--- Percent of workers spending more than an hour commuting: 16.4%
#6. Stonecrest
- Average time spent commuting to work (minutes): 38
--- Percent of workers spending less than 30 minutes commuting: 33%
--- Percent of workers spending more than an hour commuting: 21.1%
#5. Loganville
- Average time spent commuting to work (minutes): 38
--- Percent of workers spending less than 30 minutes commuting: 40.3%
--- Percent of workers spending more than an hour commuting: 21.8%
#4. Powder Springs
- Average time spent commuting to work (minutes): 38.4
--- Percent of workers spending less than 30 minutes commuting: 32.8%
--- Percent of workers spending more than an hour commuting: 20.7%
#3. Redan
- Average time spent commuting to work (minutes): 39
--- Percent of workers spending less than 30 minutes commuting: 34.7%
--- Percent of workers spending more than an hour commuting: 22.7%
#2. Holly Springs
- Average time spent commuting to work (minutes): 39.2
--- Percent of workers spending less than 30 minutes commuting: 32.3%
--- Percent of workers spending more than an hour commuting: 23.6%
#1. Snellville
- Average time spent commuting to work (minutes): 44.7
--- Percent of workers spending less than 30 minutes commuting: 26.8%
--- Percent of workers spending more than an hour commuting: 28.2%