These Counties Have The Worst Commutes In Florida & Miami-Dade Isn't No.1
We're sorry if you live in the top 10.
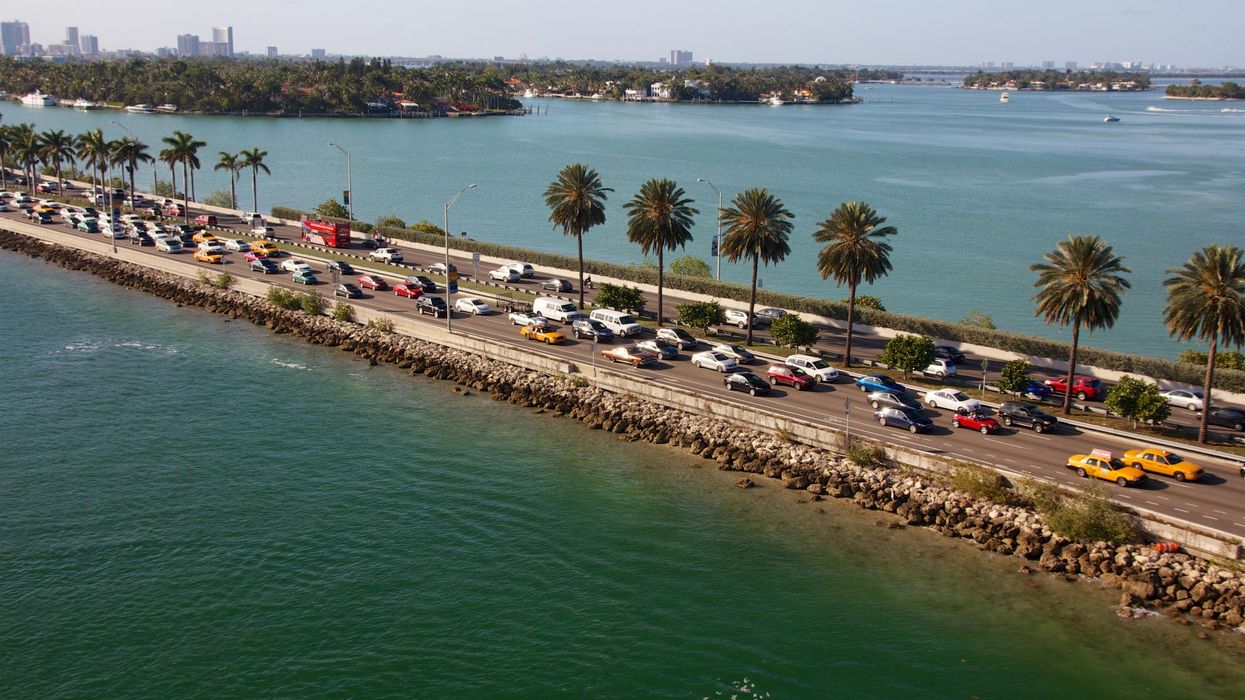
Miami traffic.
#50. Brevard County
- Average Commute Time: 25.4 minutes
--- 2.5 minutes shorter than state average
- Workers with 60+ minute commute: 6.3%
- Left for work from 12 a.m. to 6 a.m. 11.5%
- Worked outside county of residence: 7.3%
- Means of transportation: drove alone (81.3%), carpooled (7.5%), walked to work (1.0%), public transportation (0.6%), worked from home (7.6%)
#49. Columbia County
- Average Commute Time: 25.5 minutes
--- 2.4 minutes shorter than state average
- Workers with 60+ minute commute: 8.1%
- Left for work from 12 a.m. to 6 a.m. 14.7%
- Worked outside county of residence: 27.2%
- Means of transportation: drove alone (80.8%), carpooled (12.3%), walked to work (0.6%), public transportation (0.0%), worked from home (4.9%)
#48. Taylor County
- Average Commute Time: 25.5 minutes
--- 2.4 minutes shorter than state average
- Workers with 60+ minute commute: 12.0%
- Left for work from 12 a.m. to 6 a.m. 17.0%
- Worked outside county of residence: 15.3%
- Means of transportation: drove alone (85.2%), carpooled (11.7%), walked to work (0.7%), public transportation (0.0%), worked from home (0.5%)
#47. Hardee County
- Average Commute Time: 25.6 minutes
--- 2.3 minutes shorter than state average
- Workers with 60+ minute commute: 10.8%
- Left for work from 12 a.m. to 6 a.m. 21.1%
- Worked outside county of residence: 28.6%
- Means of transportation: drove alone (79.8%), carpooled (11.5%), walked to work (1.5%), public transportation (1.5%), worked from home (4.3%)
#46. DeSoto County
- Average Commute Time: 25.6 minutes
--- 2.3 minutes shorter than state average
- Workers with 60+ minute commute: 11.3%
- Left for work from 12 a.m. to 6 a.m. 17.1%
- Worked outside county of residence: 20.9%
- Means of transportation: drove alone (68.6%), carpooled (19.2%), walked to work (2.8%), public transportation (1.3%), worked from home (7.0%)
#45. Marion County
- Average Commute Time: 25.8 minutes
--- 2.1 minutes shorter than state average
- Workers with 60+ minute commute: 6.7%
- Left for work from 12 a.m. to 6 a.m. 14.2%
- Worked outside county of residence: 17.9%
- Means of transportation: drove alone (80.3%), carpooled (10.1%), walked to work (0.7%), public transportation (0.4%), worked from home (7.1%)
#44. Charlotte County
- Average Commute Time: 25.8 minutes
--- 2.1 minutes shorter than state average
- Workers with 60+ minute commute: 8.8%
- Left for work from 12 a.m. to 6 a.m. 11.2%
- Worked outside county of residence: 28.3%
- Means of transportation: drove alone (78.7%), carpooled (7.3%), walked to work (0.8%), public transportation (0.2%), worked from home (10.3%)
#43. Okeechobee County
- Average Commute Time: 25.9 minutes
--- 2.0 minutes shorter than state average
- Workers with 60+ minute commute: 12.8%
- Left for work from 12 a.m. to 6 a.m. 17.9%
- Worked outside county of residence: 22.3%
- Means of transportation: drove alone (80.6%), carpooled (9.7%), walked to work (2.1%), public transportation (1.2%), worked from home (4.3%)
#42. Jackson County
- Average Commute Time: 26.1 minutes
--- 1.8 minutes shorter than state average
- Workers with 60+ minute commute: 8.4%
- Left for work from 12 a.m. to 6 a.m. 20.6%
- Worked outside county of residence: 24.2%
- Means of transportation: drove alone (87.6%), carpooled (6.1%), walked to work (1.9%), public transportation (0.1%), worked from home (3.4%)
#41. Manatee County
- Average Commute Time: 26.2 minutes
--- 1.7 minutes shorter than state average
- Workers with 60+ minute commute: 6.2%
- Left for work from 12 a.m. to 6 a.m. 11.8%
- Worked outside county of residence: 28.5%
- Means of transportation: drove alone (76.6%), carpooled (11.0%), walked to work (1.0%), public transportation (0.5%), worked from home (8.9%)
#40. Palm Beach County
- Average Commute Time: 26.2 minutes
--- 1.7 minutes shorter than state average
- Workers with 60+ minute commute: 7.4%
- Left for work from 12 a.m. to 6 a.m. 8.5%
- Worked outside county of residence: 10.1%
- Means of transportation: drove alone (76.2%), carpooled (10.0%), walked to work (1.3%), public transportation (1.6%), worked from home (8.4%)
#39. Suwannee County
- Average Commute Time: 26.2 minutes
--- 1.7 minutes shorter than state average
- Workers with 60+ minute commute: 8.3%
- Left for work from 12 a.m. to 6 a.m. 19.5%
- Worked outside county of residence: 32.2%
- Means of transportation: drove alone (78.5%), carpooled (13.0%), walked to work (2.1%), public transportation (0.0%), worked from home (5.0%)
#38. Volusia County
- Average Commute Time: 26.3 minutes
--- 1.6 minutes shorter than state average
- Workers with 60+ minute commute: 9.8%
- Left for work from 12 a.m. to 6 a.m. 11.1%
- Worked outside county of residence: 19.9%
- Means of transportation: drove alone (79.6%), carpooled (7.8%), walked to work (1.2%), public transportation (0.9%), worked from home (8.1%)
#37. Sumter County
- Average Commute Time: 26.5 minutes
--- 1.4 minutes shorter than state average
- Workers with 60+ minute commute: 10.2%
- Left for work from 12 a.m. to 6 a.m. 15.0%
- Worked outside county of residence: 35.0%
- Means of transportation: drove alone (72.8%), carpooled (5.8%), walked to work (1.3%), public transportation (0.1%), worked from home (11.4%)
#36. Martin County
- Average Commute Time: 26.9 minutes
--- 1.0 minutes shorter than state average
- Workers with 60+ minute commute: 7.7%
- Left for work from 12 a.m. to 6 a.m. 11.4%
- Worked outside county of residence: 32.7%
- Means of transportation: drove alone (78.2%), carpooled (8.8%), walked to work (0.9%), public transportation (0.2%), worked from home (9.8%)
#35. Flagler County
- Average Commute Time: 27 minutes
--- 0.9 minutes shorter than state average
- Workers with 60+ minute commute: 7.7%
- Left for work from 12 a.m. to 6 a.m. 10.3%
- Worked outside county of residence: 38.1%
- Means of transportation: drove alone (79.6%), carpooled (9.3%), walked to work (0.4%), public transportation (0.3%), worked from home (9.0%)
#34. Union County
- Average Commute Time: 27.4 minutes
--- 0.5 minutes shorter than state average
- Workers with 60+ minute commute: 11.2%
- Left for work from 12 a.m. to 6 a.m. 22.6%
- Worked outside county of residence: 50.8%
- Means of transportation: drove alone (82.4%), carpooled (7.9%), walked to work (0.8%), public transportation (1.4%), worked from home (5.8%)
#33. Citrus County
- Average Commute Time: 27.5 minutes
--- 0.4 minutes shorter than state average
- Workers with 60+ minute commute: 9.1%
- Left for work from 12 a.m. to 6 a.m. 14.6%
- Worked outside county of residence: 22.6%
- Means of transportation: drove alone (81.2%), carpooled (7.7%), walked to work (0.9%), public transportation (0.1%), worked from home (7.7%)
#32. Lee County
- Average Commute Time: 27.6 minutes
--- 0.3 minutes shorter than state average
- Workers with 60+ minute commute: 7.3%
- Left for work from 12 a.m. to 6 a.m. 12.4%
- Worked outside county of residence: 10.9%
- Means of transportation: drove alone (77.8%), carpooled (9.8%), walked to work (1.1%), public transportation (0.7%), worked from home (7.5%)
#31. St. Johns County
- Average Commute Time: 27.8 minutes
--- 0.1 minutes shorter than state average
- Workers with 60+ minute commute: 6.5%
- Left for work from 12 a.m. to 6 a.m. 8.5%
- Worked outside county of residence: 37.8%
- Means of transportation: drove alone (76.6%), carpooled (7.1%), walked to work (1.1%), public transportation (0.1%), worked from home (12.8%)
#30. Seminole County
- Average Commute Time: 27.8 minutes
--- 0.1 minutes shorter than state average
- Workers with 60+ minute commute: 7.7%
- Left for work from 12 a.m. to 6 a.m. 9.5%
- Worked outside county of residence: 43.2%
- Means of transportation: drove alone (79.1%), carpooled (7.7%), walked to work (1.0%), public transportation (0.7%), worked from home (9.7%)
#29. St. Lucie County
- Average Commute Time: 27.8 minutes
--- 0.1 minutes shorter than state average
- Workers with 60+ minute commute: 8.7%
- Left for work from 12 a.m. to 6 a.m. 11.4%
- Worked outside county of residence: 35.5%
- Means of transportation: drove alone (80.5%), carpooled (9.8%), walked to work (1.9%), public transportation (0.4%), worked from home (5.4%)
#28. Walton County
- Average Commute Time: 28.1 minutes
--- 0.2 minutes longer than state average
- Workers with 60+ minute commute: 13.1%
- Left for work from 12 a.m. to 6 a.m. 14.7%
- Worked outside county of residence: 21.9%
- Means of transportation: drove alone (75.2%), carpooled (10.6%), walked to work (1.0%), public transportation (0.2%), worked from home (10.5%)
#27. Hendry County
- Average Commute Time: 28.2 minutes
--- 0.3 minutes longer than state average
- Workers with 60+ minute commute: 19.2%
- Left for work from 12 a.m. to 6 a.m. 23.1%
- Worked outside county of residence: 28.4%
- Means of transportation: drove alone (61.1%), carpooled (22.6%), walked to work (4.1%), public transportation (3.1%), worked from home (5.3%)
#26. Hillsborough County
- Average Commute Time: 28.4 minutes
--- 0.5 minutes longer than state average
- Workers with 60+ minute commute: 8.4%
- Left for work from 12 a.m. to 6 a.m. 11.3%
- Worked outside county of residence: 12.6%
- Means of transportation: drove alone (76.8%), carpooled (9.1%), walked to work (1.5%), public transportation (1.2%), worked from home (9.5%)
#25. Polk County
- Average Commute Time: 28.4 minutes
--- 0.5 minutes longer than state average
- Workers with 60+ minute commute: 9.1%
- Left for work from 12 a.m. to 6 a.m. 15.2%
- Worked outside county of residence: 21.7%
- Means of transportation: drove alone (82.2%), carpooled (9.8%), walked to work (0.9%), public transportation (0.4%), worked from home (5.2%)
#24. Madison County
- Average Commute Time: 28.6 minutes
--- 0.7 minutes longer than state average
- Workers with 60+ minute commute: 11.7%
- Left for work from 12 a.m. to 6 a.m. 14.3%
- Worked outside county of residence: 27.5%
- Means of transportation: drove alone (84.7%), carpooled (10.7%), walked to work (0.7%), public transportation (0.7%), worked from home (1.7%)
#23. Orange County
- Average Commute Time: 28.8 minutes
--- 0.9 minutes longer than state average
- Workers with 60+ minute commute: 6.8%
- Left for work from 12 a.m. to 6 a.m. 10.9%
- Worked outside county of residence: 13.3%
- Means of transportation: drove alone (77.2%), carpooled (9.6%), walked to work (1.3%), public transportation (2.0%), worked from home (7.4%)
#22. Broward County
- Average Commute Time: 28.9 minutes
--- 1.0 minutes longer than state average
- Workers with 60+ minute commute: 8.9%
- Left for work from 12 a.m. to 6 a.m. 9.6%
- Worked outside county of residence: 21.9%
- Means of transportation: drove alone (78.3%), carpooled (9.0%), walked to work (1.2%), public transportation (2.4%), worked from home (6.7%)
#21. Jefferson County
- Average Commute Time: 29.3 minutes
--- 1.4 minutes longer than state average
- Workers with 60+ minute commute: 2.8%
- Left for work from 12 a.m. to 6 a.m. 10.5%
- Worked outside county of residence: 62.6%
- Means of transportation: drove alone (82.5%), carpooled (12.1%), walked to work (0.4%), public transportation (0.0%), worked from home (4.3%)
#20. Calhoun County
- Average Commute Time: 29.4 minutes
--- 1.5 minutes longer than state average
- Workers with 60+ minute commute: 12.8%
- Left for work from 12 a.m. to 6 a.m. 27.2%
- Worked outside county of residence: 52.2%
- Means of transportation: drove alone (78.1%), carpooled (15.4%), walked to work (1.3%), public transportation (0.0%), worked from home (1.5%)
#19. Holmes County
- Average Commute Time: 29.5 minutes
--- 1.6 minutes longer than state average
- Workers with 60+ minute commute: 13.4%
- Left for work from 12 a.m. to 6 a.m. 24.6%
- Worked outside county of residence: 40.6%
- Means of transportation: drove alone (85.2%), carpooled (8.8%), walked to work (0.7%), public transportation (0.0%), worked from home (4.1%)
#18. Santa Rosa County
- Average Commute Time: 29.9 minutes
--- 2.0 minutes longer than state average
- Workers with 60+ minute commute: 8.3%
- Left for work from 12 a.m. to 6 a.m. 17.9%
- Worked outside county of residence: 49.1%
- Means of transportation: drove alone (80.4%), carpooled (9.9%), walked to work (0.9%), public transportation (0.0%), worked from home (6.8%)
#17. Lake County
- Average Commute Time: 29.9 minutes
--- 2.0 minutes longer than state average
- Workers with 60+ minute commute: 9.9%
- Left for work from 12 a.m. to 6 a.m. 13.8%
- Worked outside county of residence: 40.3%
- Means of transportation: drove alone (79.0%), carpooled (9.7%), walked to work (0.9%), public transportation (0.3%), worked from home (8.4%)
#16. Gilchrist County
- Average Commute Time: 29.9 minutes
--- 2.0 minutes longer than state average
- Workers with 60+ minute commute: 10.4%
- Left for work from 12 a.m. to 6 a.m. 16.3%
- Worked outside county of residence: 64.6%
- Means of transportation: drove alone (78.4%), carpooled (15.9%), walked to work (0.9%), public transportation (0.0%), worked from home (3.9%)
#15. Glades County
- Average Commute Time: 30.1 minutes
--- 2.2 minutes longer than state average
- Workers with 60+ minute commute: 18.8%
- Left for work from 12 a.m. to 6 a.m. 18.8%
- Worked outside county of residence: 67.6%
- Means of transportation: drove alone (72.5%), carpooled (15.8%), walked to work (4.5%), public transportation (1.1%), worked from home (2.5%)
#14. Hernando County
- Average Commute Time: 30.4 minutes
--- 2.5 minutes longer than state average
- Workers with 60+ minute commute: 14.8%
- Left for work from 12 a.m. to 6 a.m. 16.7%
- Worked outside county of residence: 35.8%
- Means of transportation: drove alone (78.9%), carpooled (9.4%), walked to work (1.0%), public transportation (0.3%), worked from home (8.5%)
#13. Levy County
- Average Commute Time: 30.5 minutes
--- 2.6 minutes longer than state average
- Workers with 60+ minute commute: 12.2%
- Left for work from 12 a.m. to 6 a.m. 15.0%
- Worked outside county of residence: 55.5%
- Means of transportation: drove alone (81.4%), carpooled (10.5%), walked to work (0.7%), public transportation (0.4%), worked from home (6.2%)
#12. Nassau County
- Average Commute Time: 30.8 minutes
--- 2.9 minutes longer than state average
- Workers with 60+ minute commute: 9.6%
- Left for work from 12 a.m. to 6 a.m. 17.8%
- Worked outside county of residence: 40.2%
- Means of transportation: drove alone (85.2%), carpooled (5.7%), walked to work (1.5%), public transportation (0.1%), worked from home (6.2%)
#11. Bradford County
- Average Commute Time: 31 minutes
--- 3.1 minutes longer than state average
- Workers with 60+ minute commute: 14.5%
- Left for work from 12 a.m. to 6 a.m. 14.5%
- Worked outside county of residence: 47.3%
- Means of transportation: drove alone (79.5%), carpooled (8.0%), walked to work (1.6%), public transportation (0.9%), worked from home (8.2%)
#10. Wakulla County
- Average Commute Time: 31.2 minutes
--- 3.3 minutes longer than state average
- Workers with 60+ minute commute: 8.5%
- Left for work from 12 a.m. to 6 a.m. 14.6%
- Worked outside county of residence: 57.5%
- Means of transportation: drove alone (84.8%), carpooled (8.3%), walked to work (0.6%), public transportation (0.0%), worked from home (5.8%)
#9. Gadsden County
- Average Commute Time: 31.3 minutes
--- 3.4 minutes longer than state average
- Workers with 60+ minute commute: 7.8%
- Left for work from 12 a.m. to 6 a.m. 12.0%
- Worked outside county of residence: 53.3%
- Means of transportation: drove alone (84.3%), carpooled (7.9%), walked to work (1.4%), public transportation (0.5%), worked from home (5.1%)
#8. Washington County
- Average Commute Time: 31.4 minutes
--- 3.5 minutes longer than state average
- Workers with 60+ minute commute: 17.2%
- Left for work from 12 a.m. to 6 a.m. 24.2%
- Worked outside county of residence: 49.7%
- Means of transportation: drove alone (88.2%), carpooled (7.5%), walked to work (0.5%), public transportation (0.3%), worked from home (2.6%)
#7. Pasco County
- Average Commute Time: 31.7 minutes
--- 3.8 minutes longer than state average
- Workers with 60+ minute commute: 13.9%
- Left for work from 12 a.m. to 6 a.m. 13.7%
- Worked outside county of residence: 44.2%
- Means of transportation: drove alone (78.1%), carpooled (8.3%), walked to work (0.8%), public transportation (0.6%), worked from home (10.2%)
#6. Putnam County
- Average Commute Time: 31.7 minutes
--- 3.8 minutes longer than state average
- Workers with 60+ minute commute: 16.0%
- Left for work from 12 a.m. to 6 a.m. 19.6%
- Worked outside county of residence: 38.2%
- Means of transportation: drove alone (80.9%), carpooled (9.6%), walked to work (1.7%), public transportation (0.2%), worked from home (6.2%)
#5. Liberty County
- Average Commute Time: 32.2 minutes
--- 4.3 minutes longer than state average
- Workers with 60+ minute commute: 16.7%
- Left for work from 12 a.m. to 6 a.m. 27.0%
- Worked outside county of residence: 44.7%
- Means of transportation: drove alone (80.0%), carpooled (13.9%), walked to work (0.6%), public transportation (0.0%), worked from home (2.7%)
#4. Baker County
- Average Commute Time: 32.4 minutes
--- 4.5 minutes longer than state average
- Workers with 60+ minute commute: 13.6%
- Left for work from 12 a.m. to 6 a.m. 21.7%
- Worked outside county of residence: 49.4%
- Means of transportation: drove alone (82.2%), carpooled (8.0%), walked to work (2.2%), public transportation (0.0%), worked from home (4.2%)
#3. Miami-Dade County
- Average Commute Time: 32.5 minutes
--- 4.6 minutes longer than state average
- Workers with 60+ minute commute: 13.5%
- Left for work from 12 a.m. to 6 a.m. 10.3%
- Worked outside county of residence: 6.8%
- Means of transportation: drove alone (75.7%), carpooled (8.9%), walked to work (1.9%), public transportation (4.2%), worked from home (6.7%)
#2. Clay County
- Average Commute Time: 33.4 minutes
--- 5.5 minutes longer than state average
- Workers with 60+ minute commute: 13.0%
- Left for work from 12 a.m. to 6 a.m. 17.3%
- Worked outside county of residence: 53.5%
- Means of transportation: drove alone (78.9%), carpooled (9.0%), walked to work (0.9%), public transportation (0.1%), worked from home (8.8%)
#1. Osceola County
- Average Commute Time: 34.3 minutes
--- 6.4 minutes longer than state average
- Workers with 60+ minute commute: 13.0%
- Left for work from 12 a.m. to 6 a.m. 14.0%
- Worked outside county of residence: 51.2%
- Means of transportation: drove alone (77.6%), carpooled (12.9%), walked to work (0.7%), public transportation (1.2%), worked from home (6.0%)
This article's cover image was used for illustrative purposes only.