
It's no surprise that COVID-19 daily cases in Canada have been on the rise lately but looking at the graph about it shows how steep that rise has been.
On December 11, the Public Health Agency of Canada put out new data and modelling which includes information about how the case counts have changed.
Editor's Choice: It's Officially 2 Weeks From Christmas & If You're Quarantining It Starts Now
 Courtesy of Public Health Agency of Canada
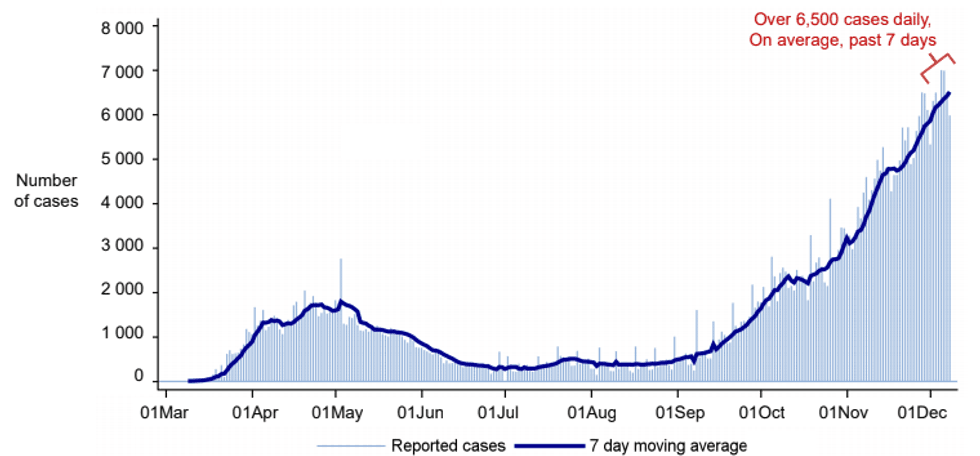
As of December 8, there was an average of more than 6,500 new cases a day in the previous seven days.
When it comes to the seven-day moving average, the country exceeded the previous high from the first wave at the beginning of October.
Even from September, the case counts have risen sharply compared to what happened in the spring.
Based on the graph, records for the highest daily reported cases have almost been broken every day in the last couple of months.
In terms of the country's positivity rate, it's been at or above 6% since November.
That number was way higher in April when it peaked at over 10% but fewer people were being tested on average back then compared to now.
The new data and modelling also showed that Canada could hit 12,000 daily cases in January even if we don't start seeing more people than we currently are.