BC's New Interactive Maps Show What Areas Are Most Vulnerable To Climate Change
Flooding and smoke pose a higher risk for some.
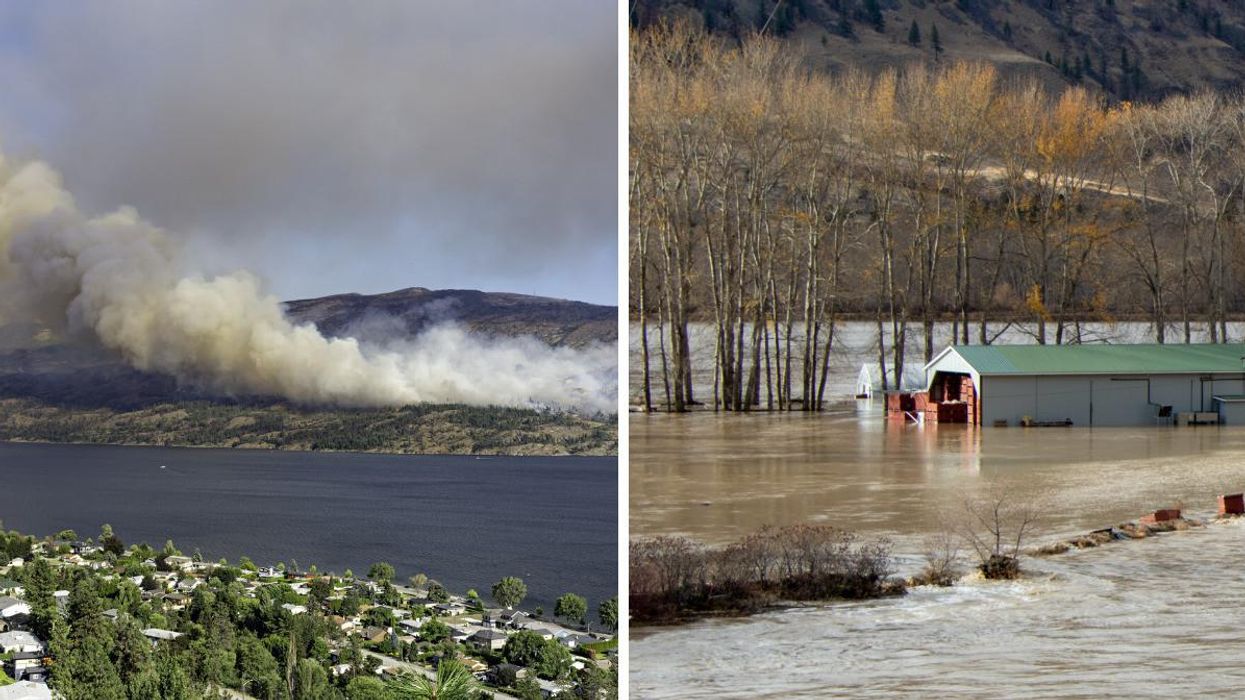
A wildfire in B.C. Right: Flooding in B.C.
There are now interactive maps that show how impacted communities in B.C. will be by climate change hazards like wildfire smoke, extreme temperatures, and flooding.
With the devastating flooding and the heat dome that B.C. was hit with last year, the reality of climate change seems very clear. These new maps allow people to see who is most at risk, for some of the effects.
Interior Health released the maps, and the CEO, Susan Brown, said that "recent events have demonstrated the importance of planning and preparing for natural disasters associated with climate change."
She encouraged people in the province to start planning "for the effects of climate change."
There are four separate interactive maps, called The Community Health and Climate Change maps, which show climate-sensitive areas. The maps show how vulnerable areas are to high temperatures, low temperatures, flooding, and wildfire smoke.
Interior Health said that the maps are "a snapshot in time that project risks and probability related to weather-related events in the Interior."
They are intended to help with city planning and for leaders to better understand climate change impacts on communities.
Using the interactive map you can select your region in B.C. and "view that region's overall vulnerability, exposure, sensitivity, and adaptive capacity layers for each climate hazard," the website said.
The vulnerability to each hazard is being measured by the communities' exposure, sensitivity and adaptive capacity. The maps then combine the data on these factors, in order to present the vulnerability of each area.
The website said that as "communities become more prepared, and as demographics change, so too will the maps."
You can access the maps on the Interior Health website, here.
This article's cover image was used for illustrative purposes only.
- A BC Woman Was Diagnosed With Suffering From 'Climate Change ... ›
- BC's 2022 Summer Weather Forecast Is Out & 'Blistering Hot ... ›
- This BC City Could Soon Face The Hottest Heat Waves In Canada ... ›
- 5 Ways To Prepare For The BC Wildfire Season, According To Experts - Narcity ›
- Vancouver Had The Worst Air Quality In The World This Weekend & It Looked Wild (VIDEOS) - Narcity ›
- Climate Activists Threw Maple Syrup On A Painting At A Vancouver Art Gallery (VIDEO) - Narcity ›
- Climate Activists Threw Maple Syrup On A Painting At A Vancouver Art Gallery (VIDEO) - Narcity ›